How to Review Your SleakOps Costs
Learn how to read your AWS spend inside SleakOps — where to look, how to drill down to the resource that's driving a cost, and what to check first when a number looks off.
Why Review Your Costs Regularly
AWS spend changes as your infrastructure changes: a new environment, an autoscaled workload, a nodepool running more On-Demand nodes than expected. Checking the Cost Explorer on a regular cadence — weekly or at least once a month — lets you catch that drift while it's still a small number, instead of finding out at the end of the month.
This guide covers reading and interpreting what you're already spending. If you're looking for ways to actively cut costs, see AWS Cost Optimization Strategies and the Cost Optimization Strategies section of the Nodepool Strategies guide.
The Cost Explorer (/billing)
The Cost Explorer is the main place to review spend across every AWS account connected to your company.
Getting there — any of these:
- Click Go to Cost Explorer on the cost card in the main Dashboard.
- Open the detail view of a Cluster, Project, or Dependency and click its Cost Explorer button — this opens the Cost Explorer pre-filtered to that specific resource.
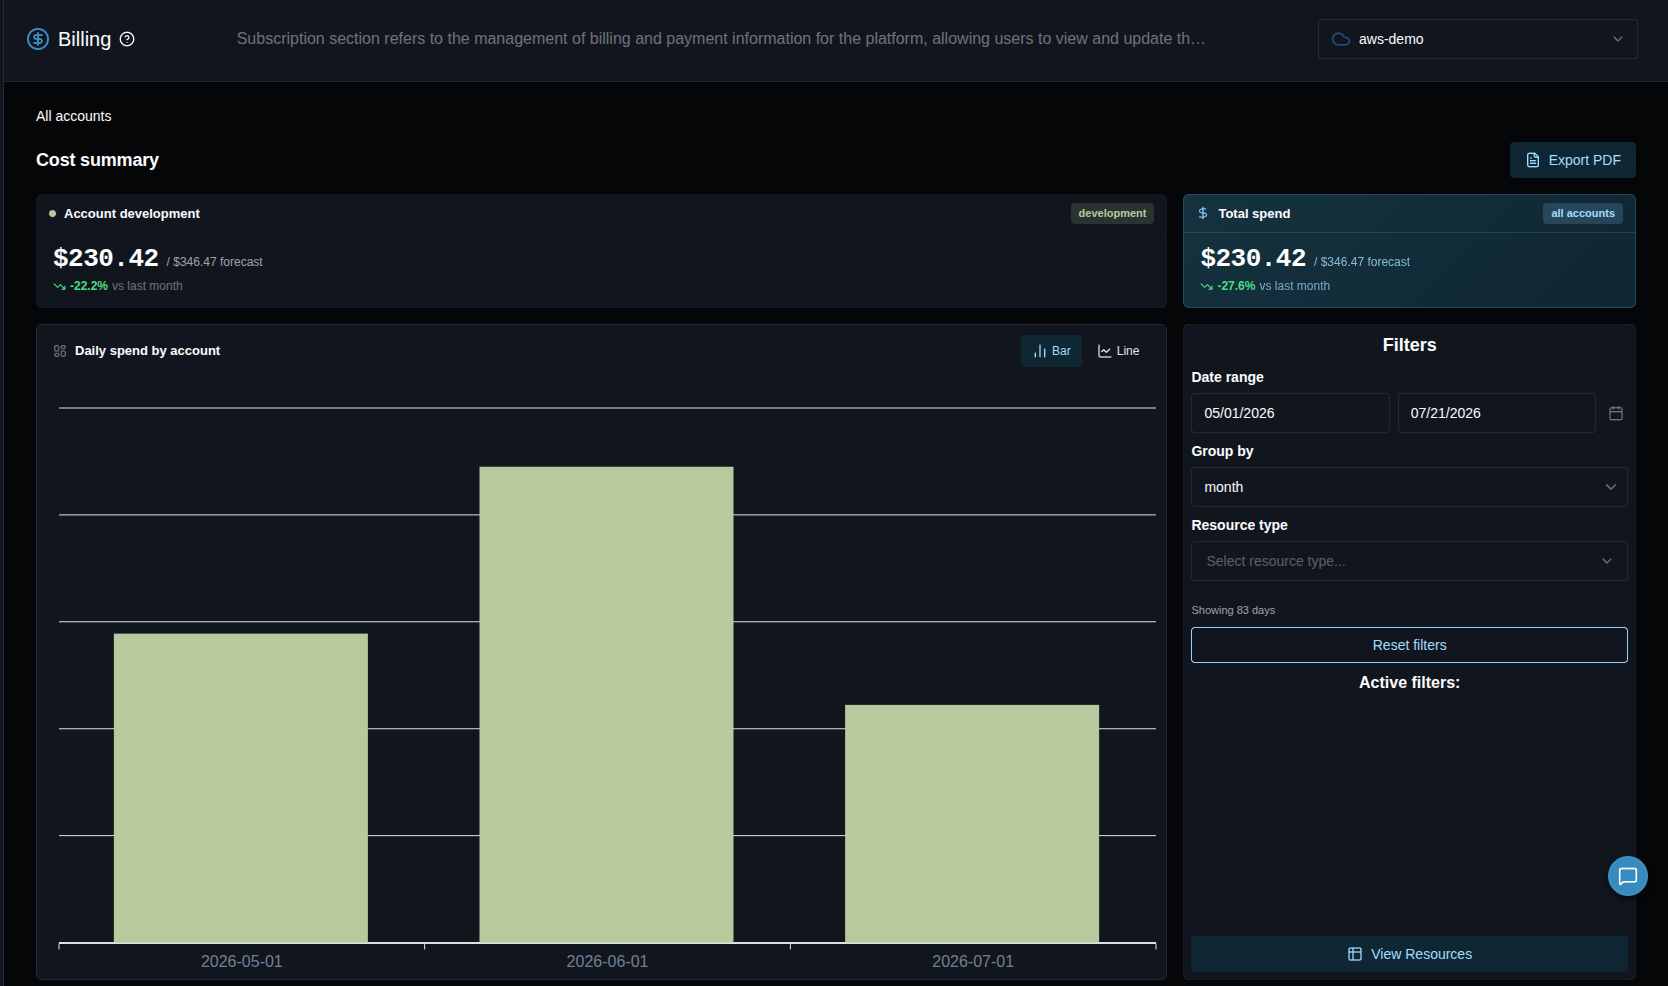
Account cards — one per AWS account (production, development, management), each showing:
- Current month cost.
- Forecast month cost (projected total for the current month based on spend so far).
- Variation versus the previous month.
Filters:
| Filter | Options |
|---|---|
| Date range | Last 7 days, Last 30 days, Last 90 days, This month, Last month, Last quarter, or a custom range |
| Group by | day, week, month |
| Resource type | Cluster, Environment, NodePool, Addon, ProjectEnv, Dependency |
Drill-down — click a bar in the chart to go one level deeper: account → resource type → individual resource (a specific cluster, dependency, or project environment). Click View Resources to open the full, paginated list of resources behind the current selection, with name, date, cost, account, and resource type.
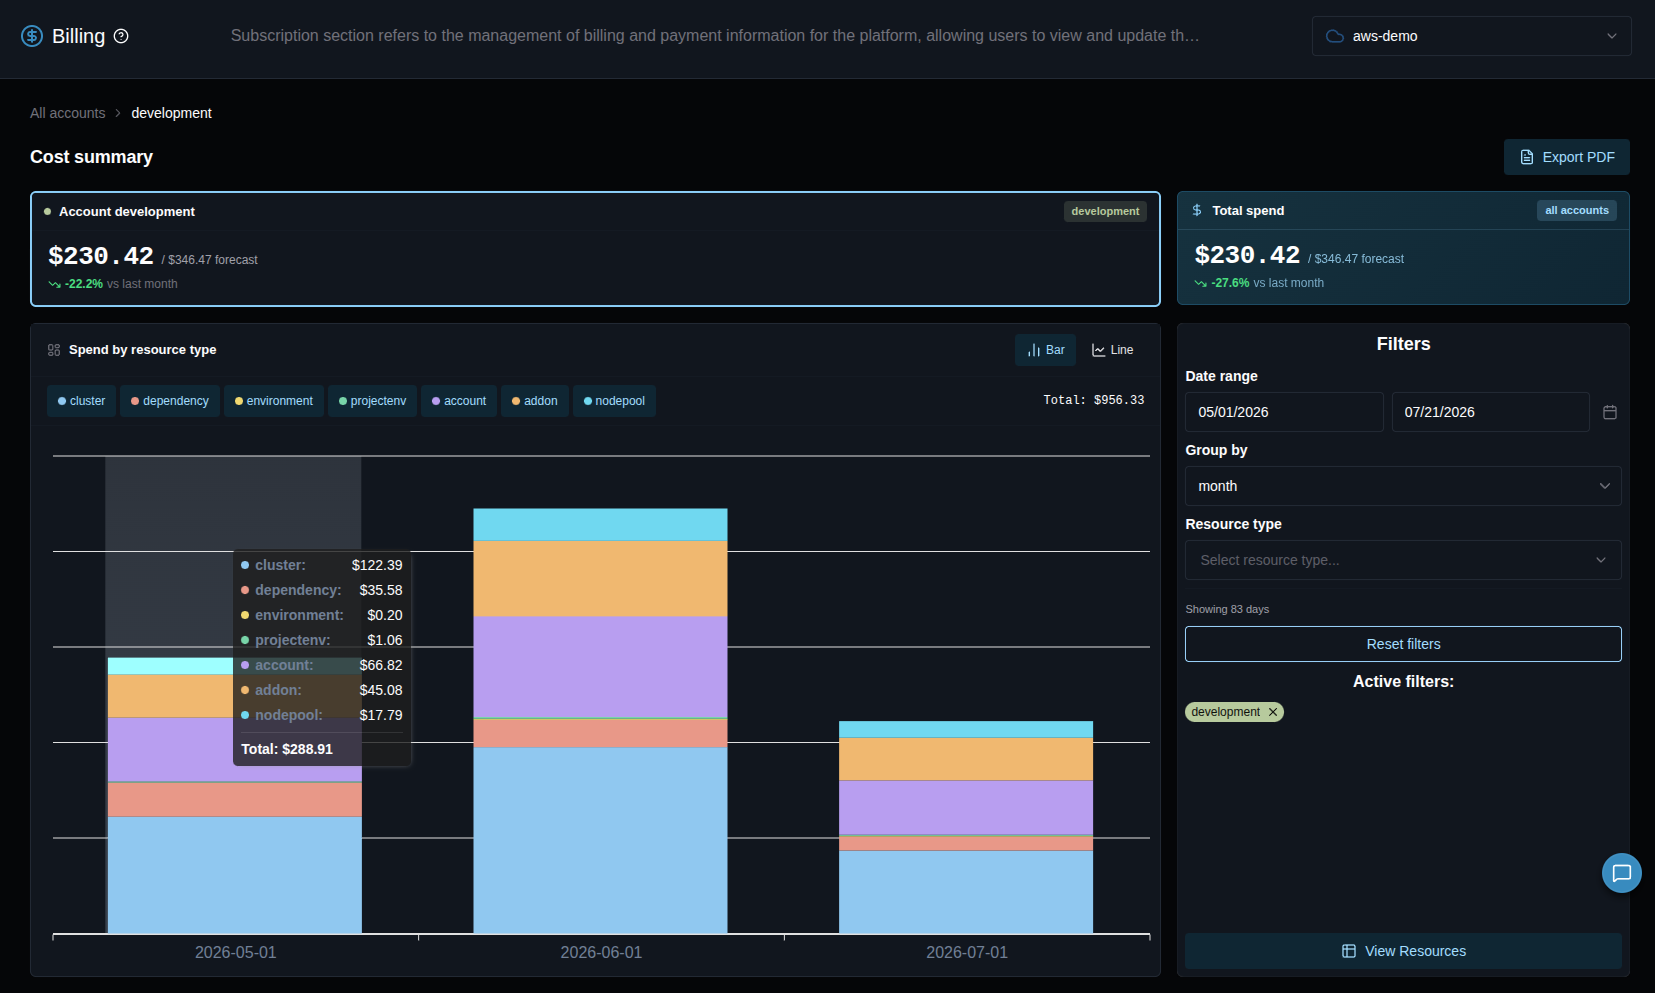
Exporting — use Export CSV to download the resource list, or Export PDF to download a summary that includes the chart.
Going Deeper at the Cluster Level with Kubecost
The Cost Explorer's Resource type filters stop at the SleakOps object level (cluster, project environment, dependency, etc.). To break costs down further — by Kubernetes namespace, pod, deployment, or node — install the Kubecost addon on the cluster.
Once Resource type is set to Cluster and a cluster is selected, the Cost Explorer shows a Kubecost tag:
- If Kubecost is installed, the tag opens its dashboard, filtered to that cluster's cost details.
- If it isn't installed yet, the tag links to the addon installation form.
Kubecost's own dashboard is where you'll find the idle cost metric — capacity you're paying for but not using — and per-namespace, per-node, and storage cost breakdowns. See the Kubecost documentation for how to read that dashboard.
The AI-Powered Cost Optimization Report
Beyond the manual review, SleakOps can generate a cost optimization report for you using AI. It's a good complement on a longer cadence — every quarter or semester — when you want a consolidated picture with recommendations instead of walking the dashboards yourself.
To generate one:
- Go to Settings → Reports and click Create Report.
- In the support drawer, pick the "Informe de Costos" card and confirm with Generate Report.
- The report is generated inside a support conversation — once it's ready, it shows up in the Reports list. Use Open report to view it in a new tab; from there you can print it or save it as PDF.
The report includes a detailed AWS cost breakdown by service, spend trends over the last 3 months, and optimization recommendations. If you're specifically after Kubernetes right-sizing, the "Análisis de Overprovisioning K8s" report in the same catalog compares your workloads' requests against actual usage and suggests adjustments.
Two things to keep in mind:
- Generating a report has a variable AI cost depending on the complexity of the analysis, drawn from your company's monthly AI budget (configurable in Settings).
- The Reports section is available to admin and editor users with the feature enabled — if you don't see it in Settings, ask us through Support.
Where Your Costs Come From
The Cost Explorer tells you how much and where; these pages explain why a resource costs what it costs:
- Nodepool strategy (Spot vs. On-Demand vs. Reserved, ARM vs. AMD) — see Node Pools and the Nodepool Strategies tutorial.
- Workload sizing (CPU/Memory requests, autoscaling limits) — a workload's requests are the floor of what it reserves, and drive most of its Kubecost
idlecost when they're set higher than actual usage. See Web Service configuration. - Cluster uptime — if a cluster doesn't need to run 24/7, a scheduled shutdown stops charging for that time window.
If You Don't See a Cost Breakdown
The per-resource breakdown in the Cost Explorer depends on Cost Allocation Tags being active in the AWS account. SleakOps enables these automatically during onboarding, but AWS can take a few days to propagate them, and in some accounts the activation needs a manual nudge.
If they aren't active yet, the Cost Explorer for that account only shows the account's total daily cost, with no resource-level split. If that's the case:
- Check for a notification titled "CostAllocationTags are not active in your AWS root account" — it links directly to the AWS Cost Management console.
- Follow the link and activate the tags listed there (
Model,Name,Cluster,ClusterId,Environment,Dependency). - The breakdown becomes available once AWS finishes propagating the tags — this isn't instant, so expect a short delay.
Next Step: Reducing What You Spend
Once you know where your spend is going, AWS Cost Optimization Strategies and the Nodepool Strategies tutorial walk through concrete ways to bring it down — Spot instances, right-sizing, Graviton, storage lifecycle policies, and more.