Loki's Dashboard is not responding
Remove the 'loki-read' pod. After 60 seconds, it will start working again, along with the Loki DataSource and its related dashboards.
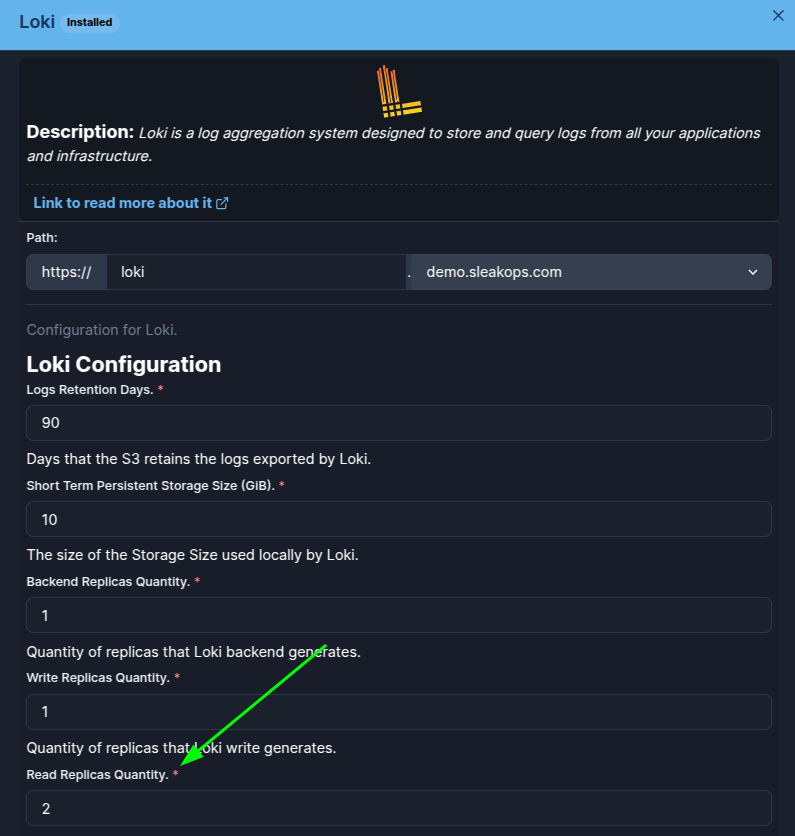
This error is more common in clusters with low availability because they generate more node and pod turnover. You can reduce the frequency of this error by increasing the number of loki-read pods in the Loki add-on settings.
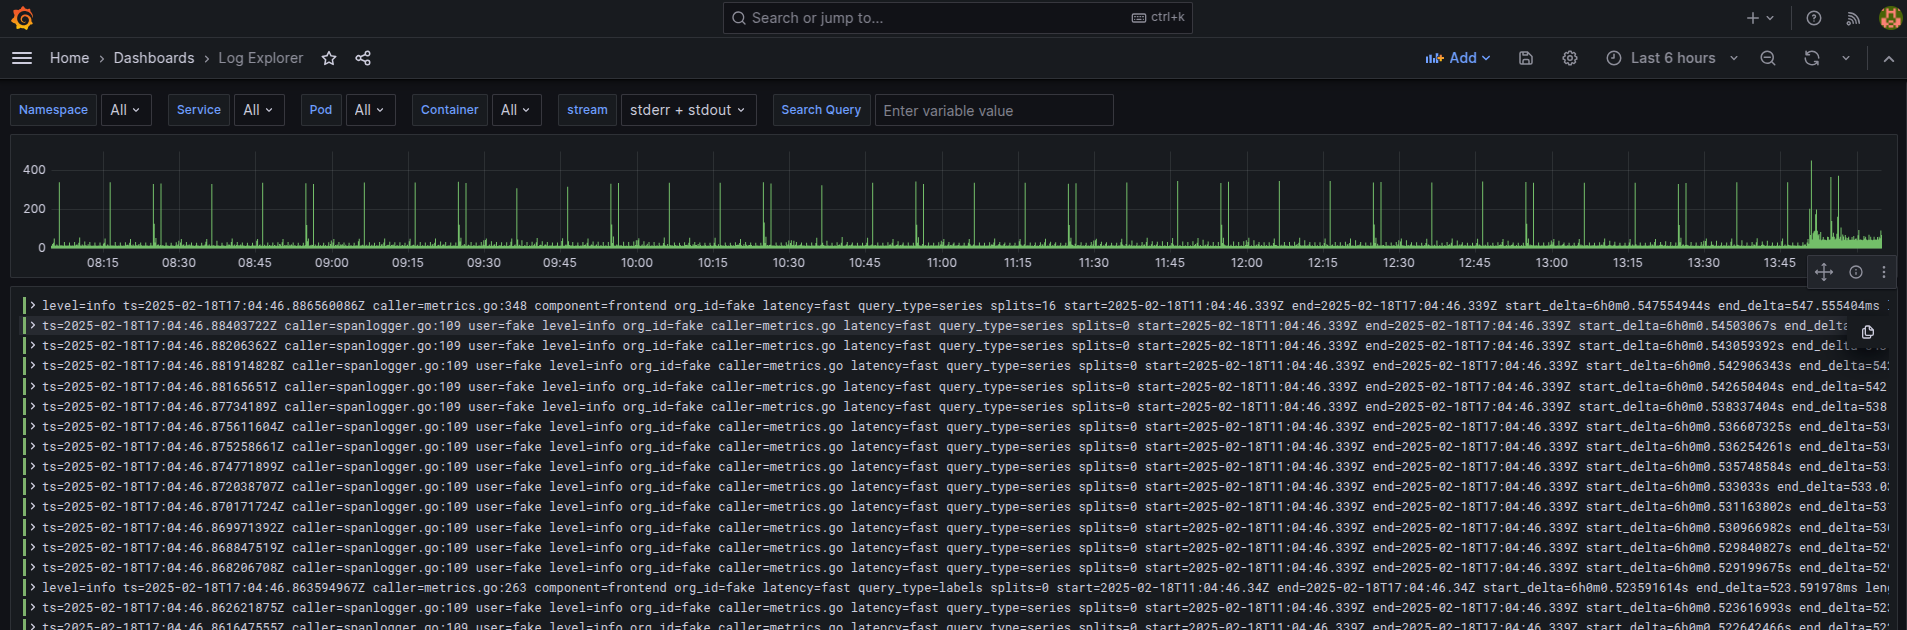
Loki may be running, as in the following image:
- If, due to some Kubernetes rotation, the loki-backend pod is reset WITHOUT the loki-read pod being reset, it starts to fail, such as when I force it by restarting the loki-backend StatefulSet, which leads to the following situation:
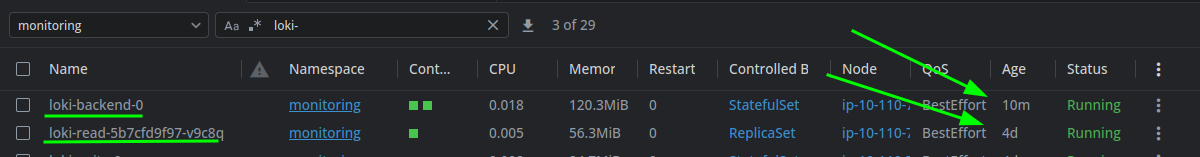
It can be seen that the 'Age' of loki-backend is less than the 'Age' of loki-read. In these cases, this error occurs, causing the Loki DataSource to malfunction and, consequently, the dashboards that use it to stop working. The error arises because the 'loki-read' pods do not attempt to reconnect to 'loki-backend' and remain in this state where they do not respond to requests from 'loki-backend'.
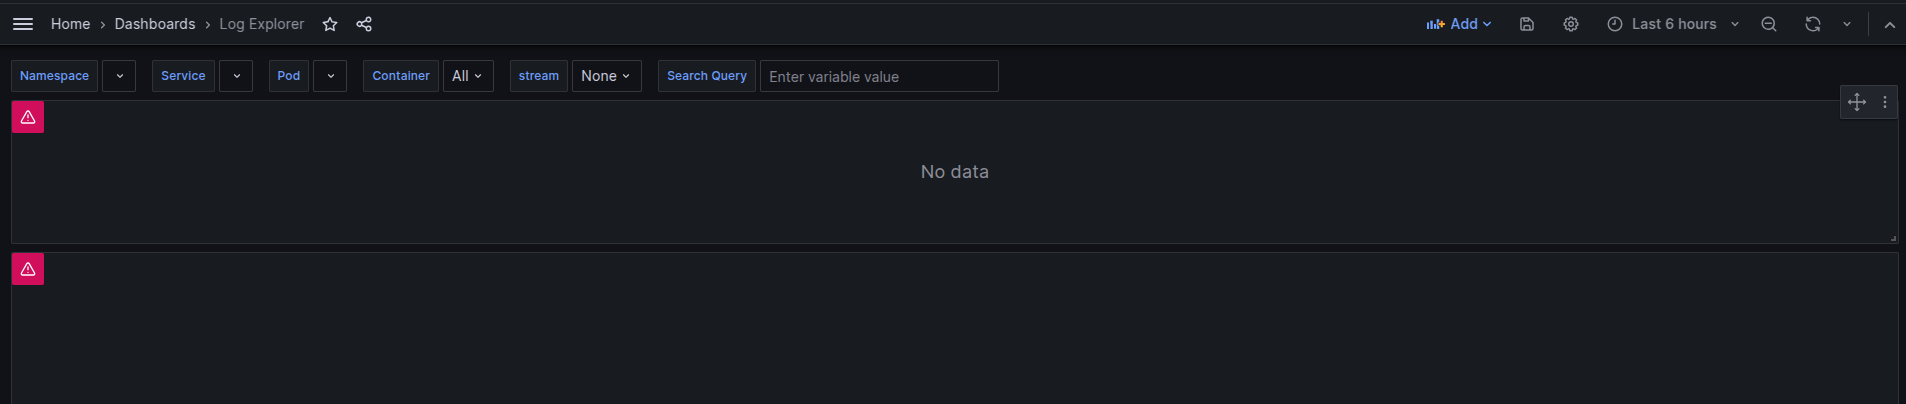
- It can be seen that the error was successfully forced, and now the dashboard is unresponsive:
- The way to fix it is by restarting the 'loki-read' Deployment or by removing the running Pod.
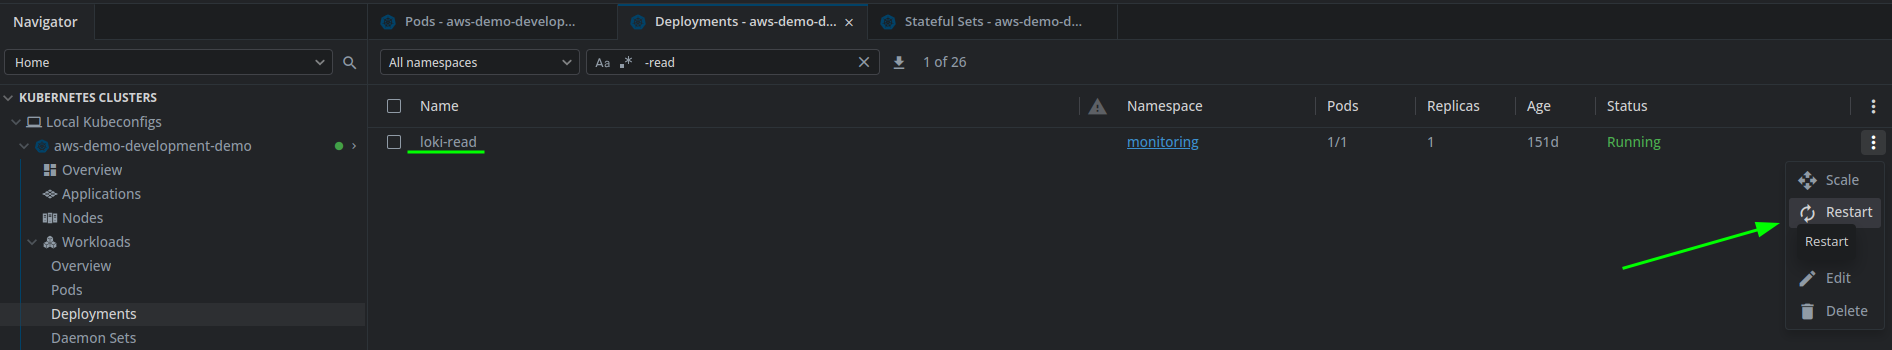
- Once that is done, we return to the desired situation, which is as follows:
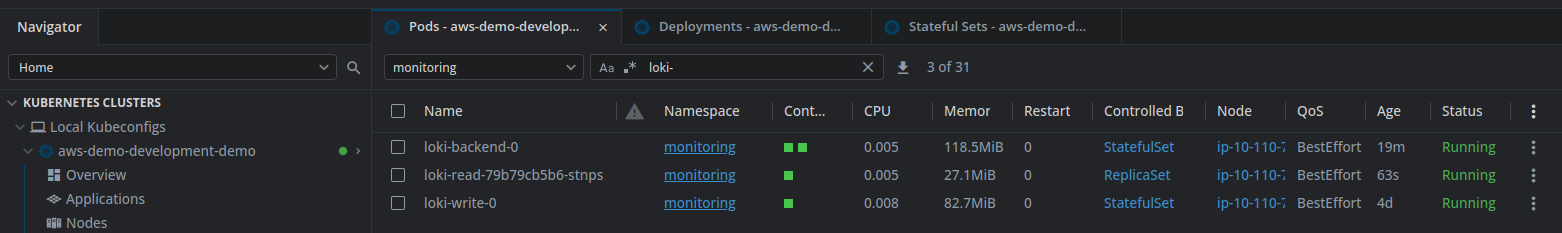
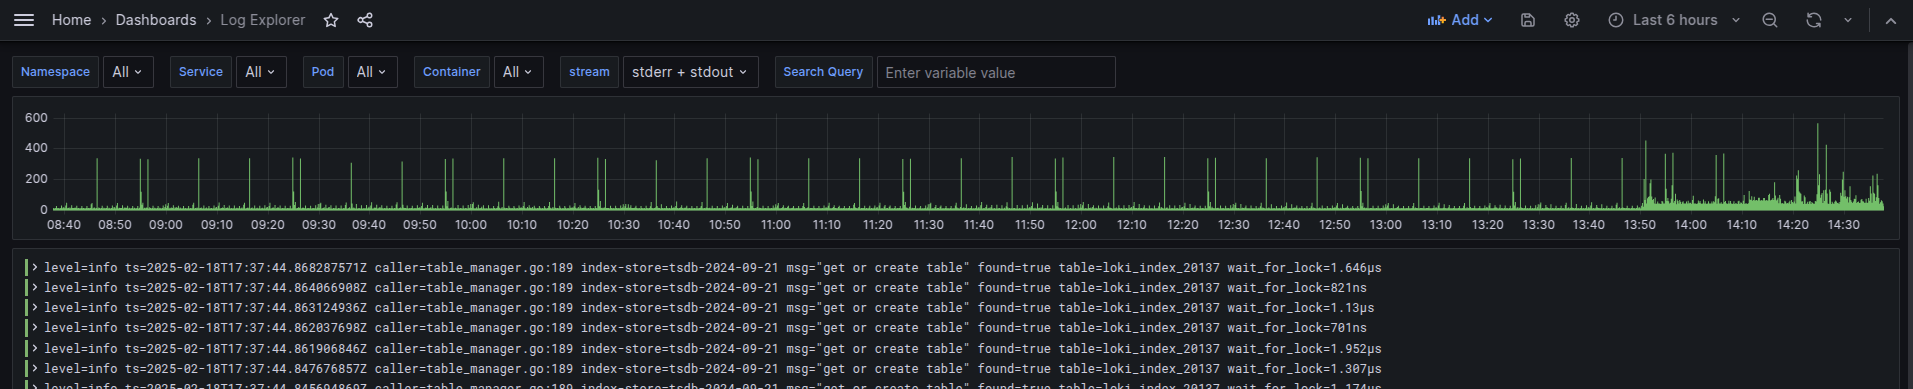
As you can see, the Age of loki-read is now less than the Age of loki-backend, which confirms that loki-read is connected and the Dashboard is working correctly again, as shown in the following image:
The frequency of this error can be reduced by increasing the number of active 'loki-read' pods. This can be done in the Loki Addon settings.