Chart
A Chart is a fundamental component of a Project that defines what SleakOps deploys during a deployment run. Charts in SleakOps are analogous to Helm Charts but are specifically adapted for SleakOps functionality.
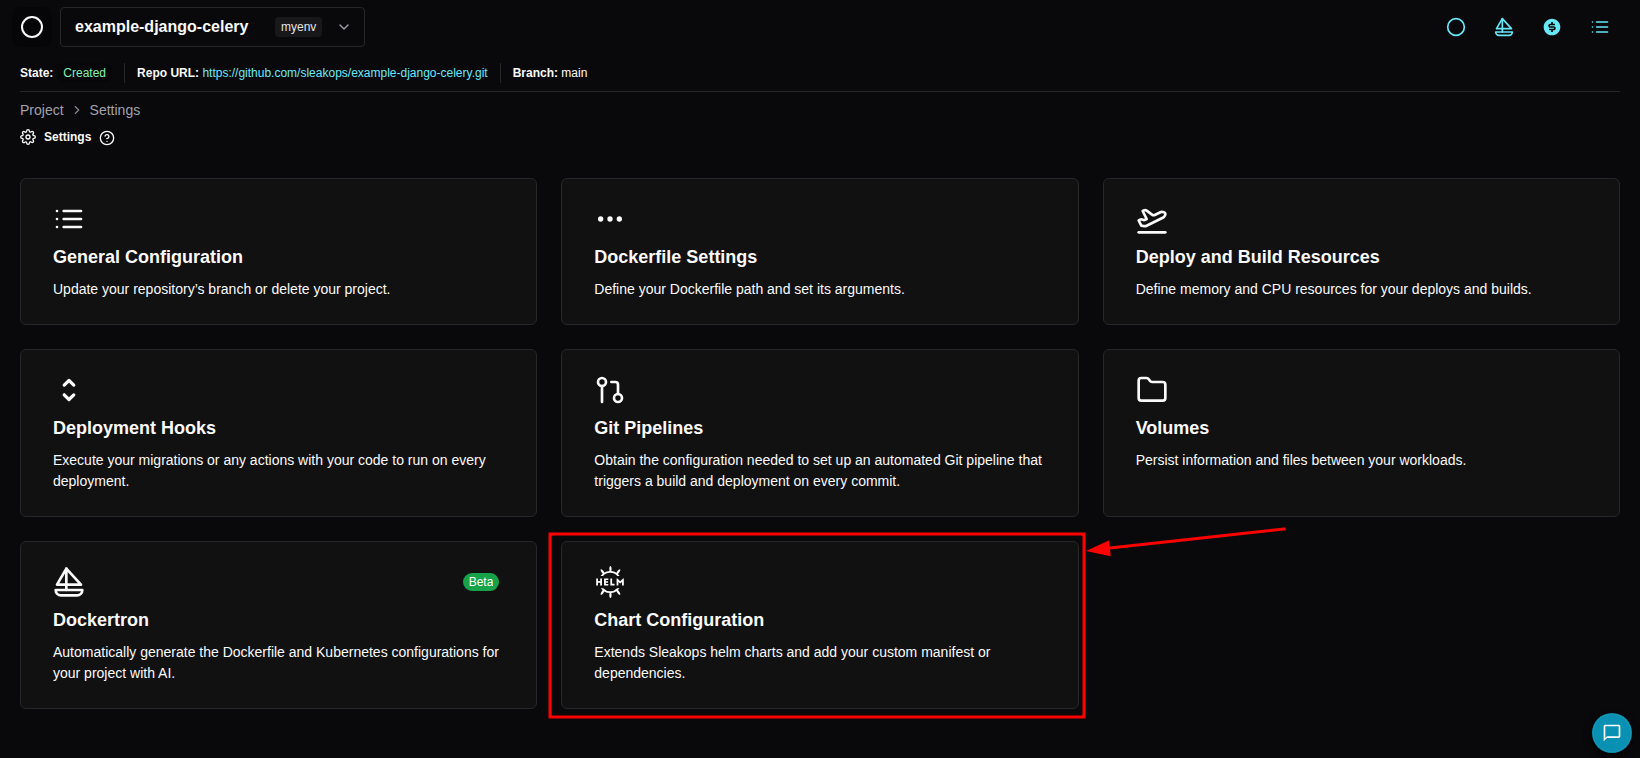
Accessing the Chart Configuration
You can find the Chart section by navigating to Project → Settings:
SleakOps uses NodePools to determine where resources are deployed. You must configure the tolerations parameter to target an existing NodePool for all deployed resources.
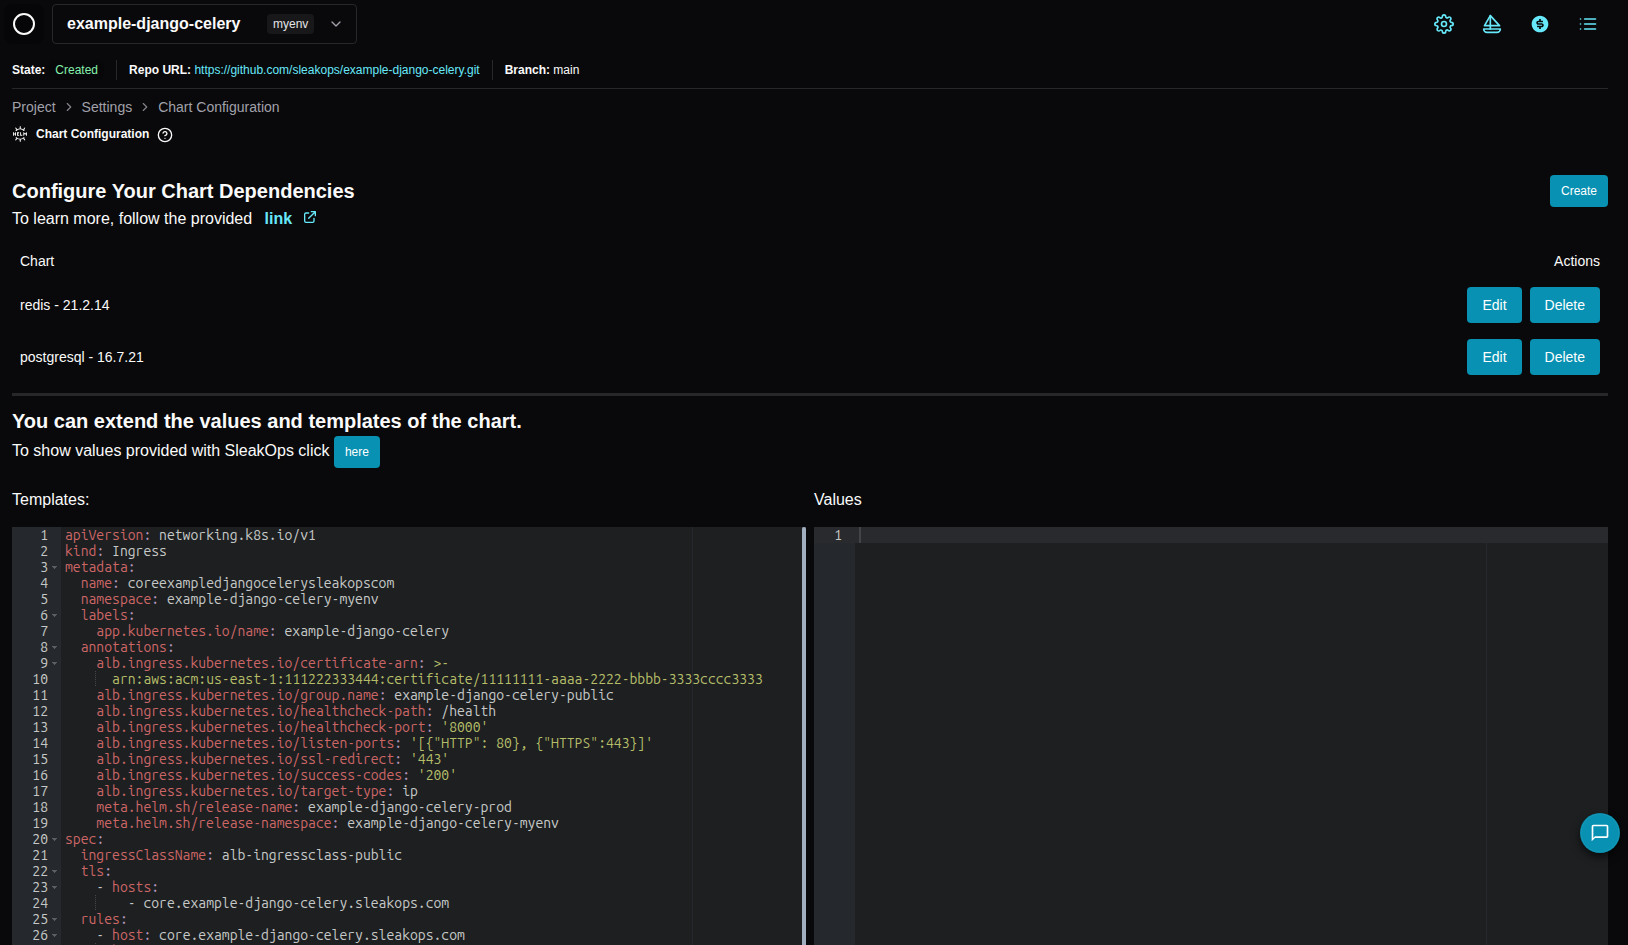
Default Values
SleakOps automatically applies default values to its Charts. You can view these values by clicking the designated area:
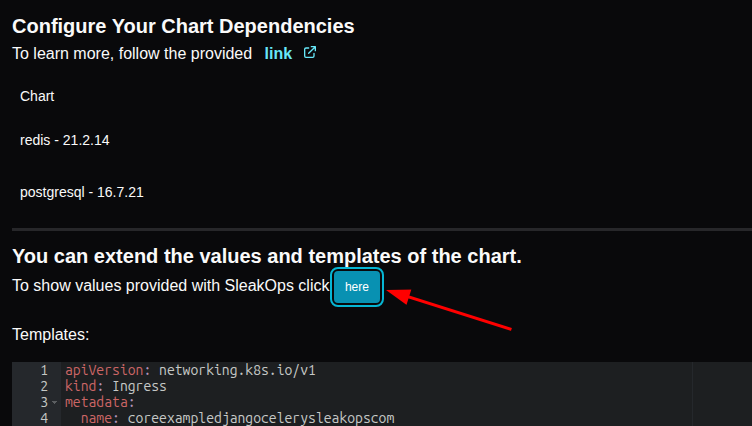
This opens a drawer on the right side displaying the default values for all Project workloads.
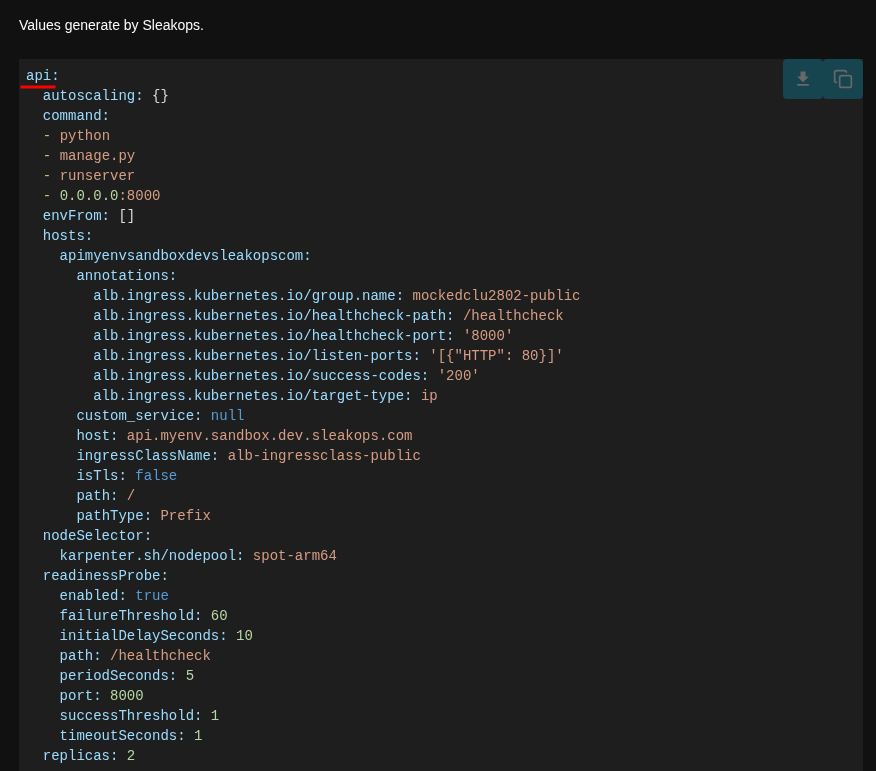
Workload-Specific Values
For example, here are the default values for an 'api' WebService:
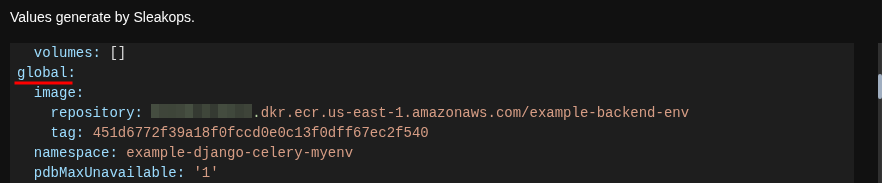
Global Valuess
Values that apply across the entire Project: