Open Telemetry
In Sleakops Opentelemetry is an addon that enables you to understand the internal state of a system by examining its telemetry data, which includes traces and metrics. Opentelemetry is installed alongside Prometheus to store valuable metrics about the system and Grafana to visualize the data.
All OpenTelemetry data is accesible through Grafana. Check our Grafana documentation to learn more about our implementation.
FAQs
How it works
In order to use OpenTelemetry, you need to have a project instrumented with OpenTelemetry. Sleakops will deploy the necessary resources to collect and store the data. Instrumentation is the process of adding code to your application to collect telemetry data. OpenTelemetry provides libraries to instrument your application in a variety of languages. Also Sleakops offers Autoinstrumentation for some languages, learn more about it in the section Autoinstrumentation.
Traces and Metrics
Telemetry data consist of three main components: traces, metrics and logs. For logs Sleakops offers Loki. Traces are the path of a request through the system, while metrics are the values of the system at a given time.
The OpenTelemetry addon collects traces from the pods running your project and sends them to the OpenTelemetry collector. The collector stores the traces throw Tempo . Traces could be visualized in Grafana. Also the collector generates metrics via the SpanMetrics Connector and stores them in Prometheus.
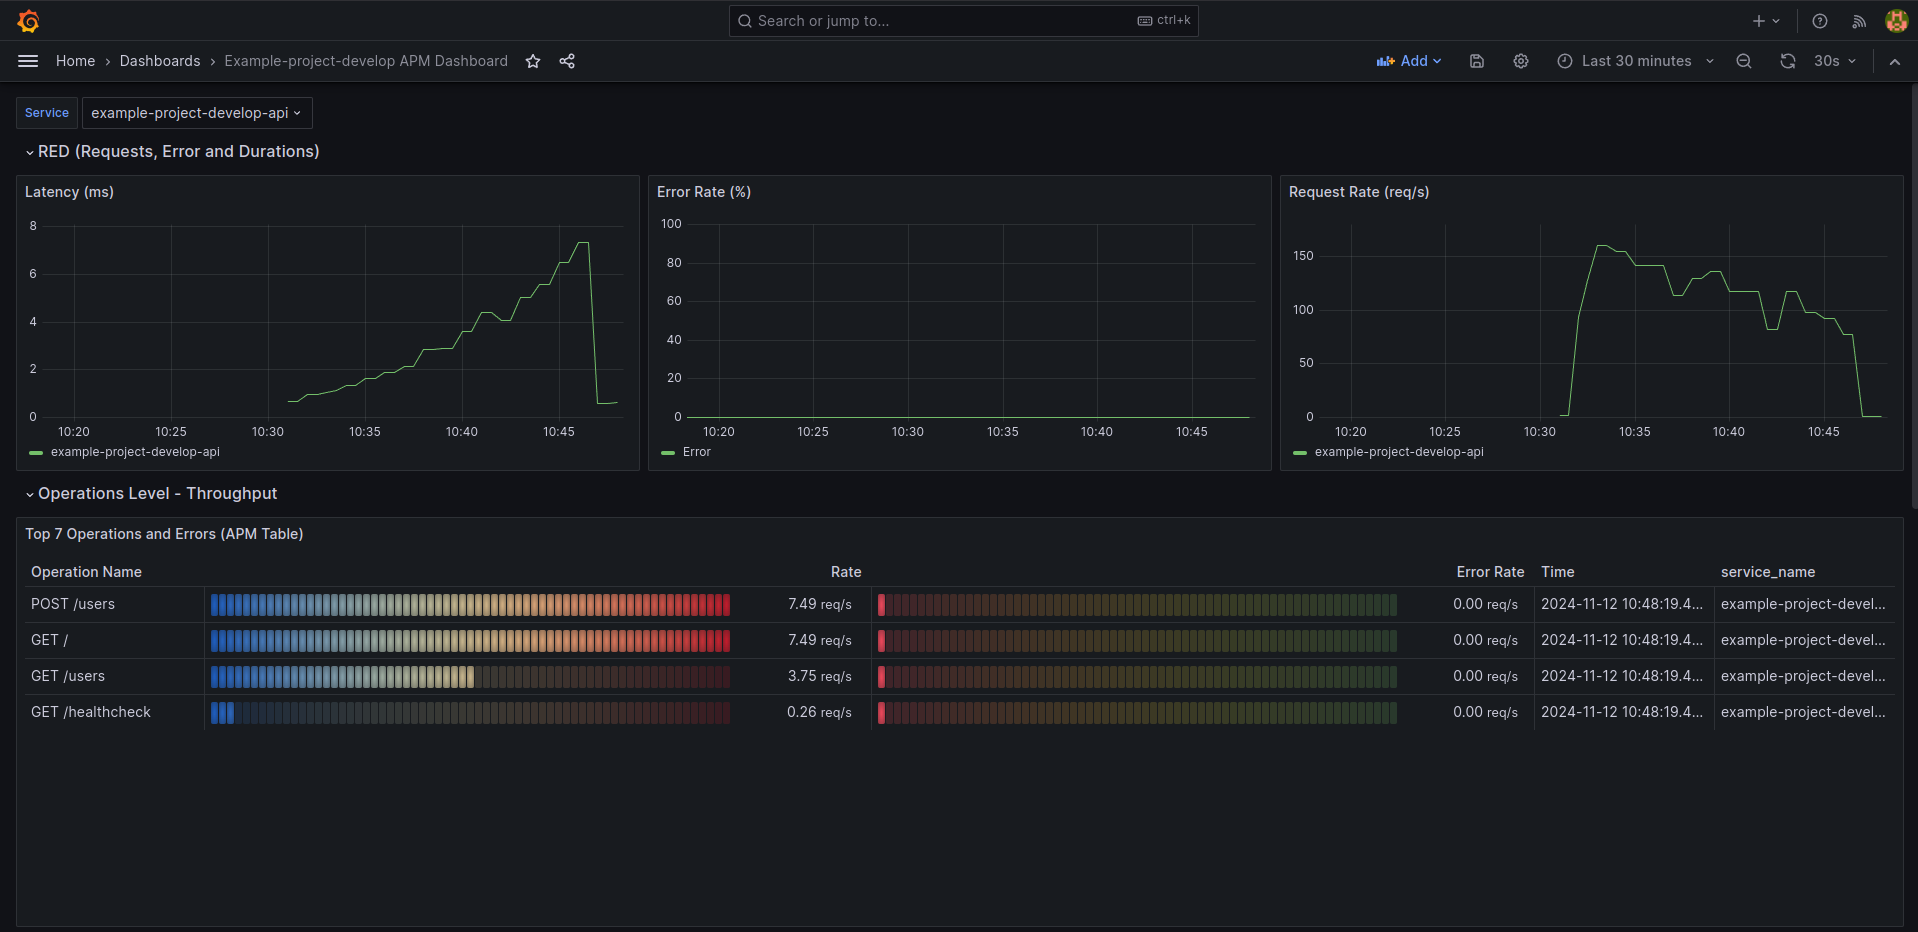
A dashboard is available in Grafana for every project that gets instrumented.
Using the Addon
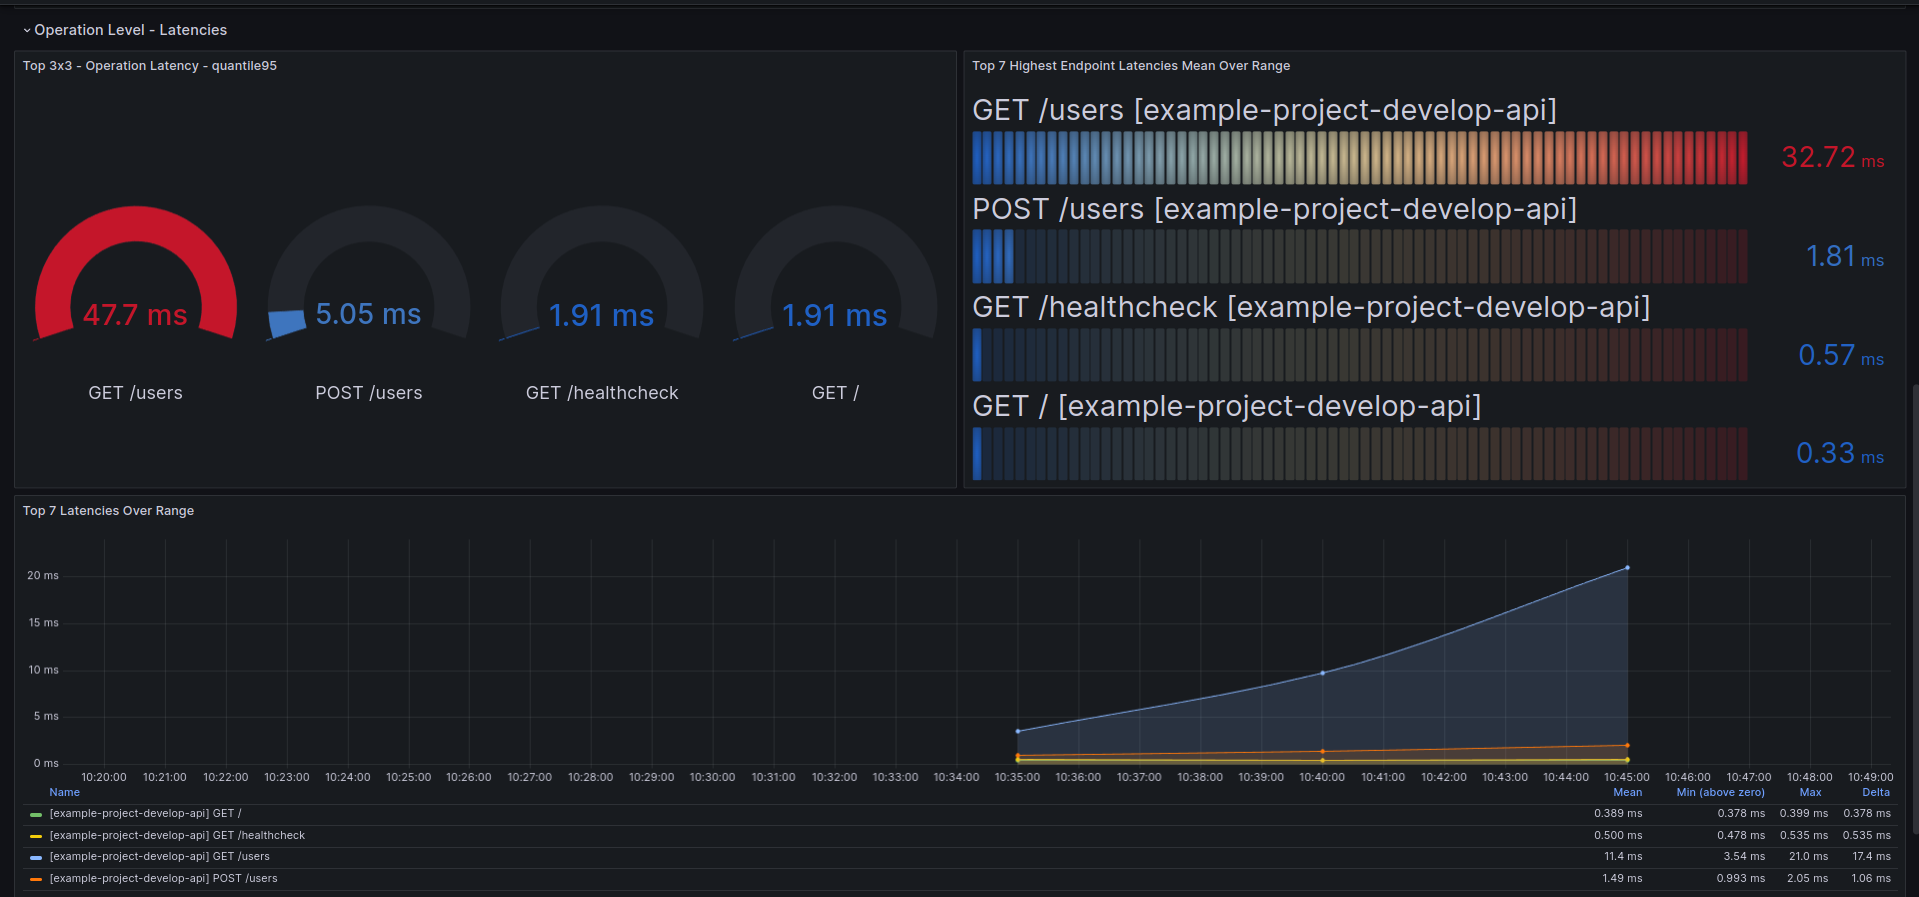
Let's dive in with a view of the OpenTelemetry dashboard. First three metrics are Request rates, Error rates and Durations, or RED metrics. These metrics are the most important to monitor the health of your application. Then we see a table that list Top operations (endpoints) and their error rate as well.


Tipically the dashboard gives a quick look to problematic endpoints, application performance bottlenecks, as well as the overall health of the application.
Autoinstrumentation
Sleakops offers autoinstrumentation for some languages. This means that Sleakops will automatically instrument your project with OpenTelemetry. This is done by deploying an init container alongside your project. The sidecar container will collect the telemetry data and send it to the OpenTelemetry collector.
Manual instrumentation
Manual instrumentation resolves the implementation through code of OpenTelemetry in your project. This is done by adding the OpenTelemetry libraries to your project and adding the necessary code to collect the telemetry data. Sleakops presents the endpoint where the telemetry data should be sent.
What does Sleakops install when installing OpenTelemetry
The stack deployed when the addon is installed is the following:
- OpenTelemetry Operator
- OpenTelemetry Collector Custom resource (CRD)
- OpenTelemetry Instrumentation Custom resource (CRD) for every autoinstrumentated project
- Tempo with a frontend, and caching enabled
- S3 Bucket as Tempo Backend
Start using OpenTelemetry
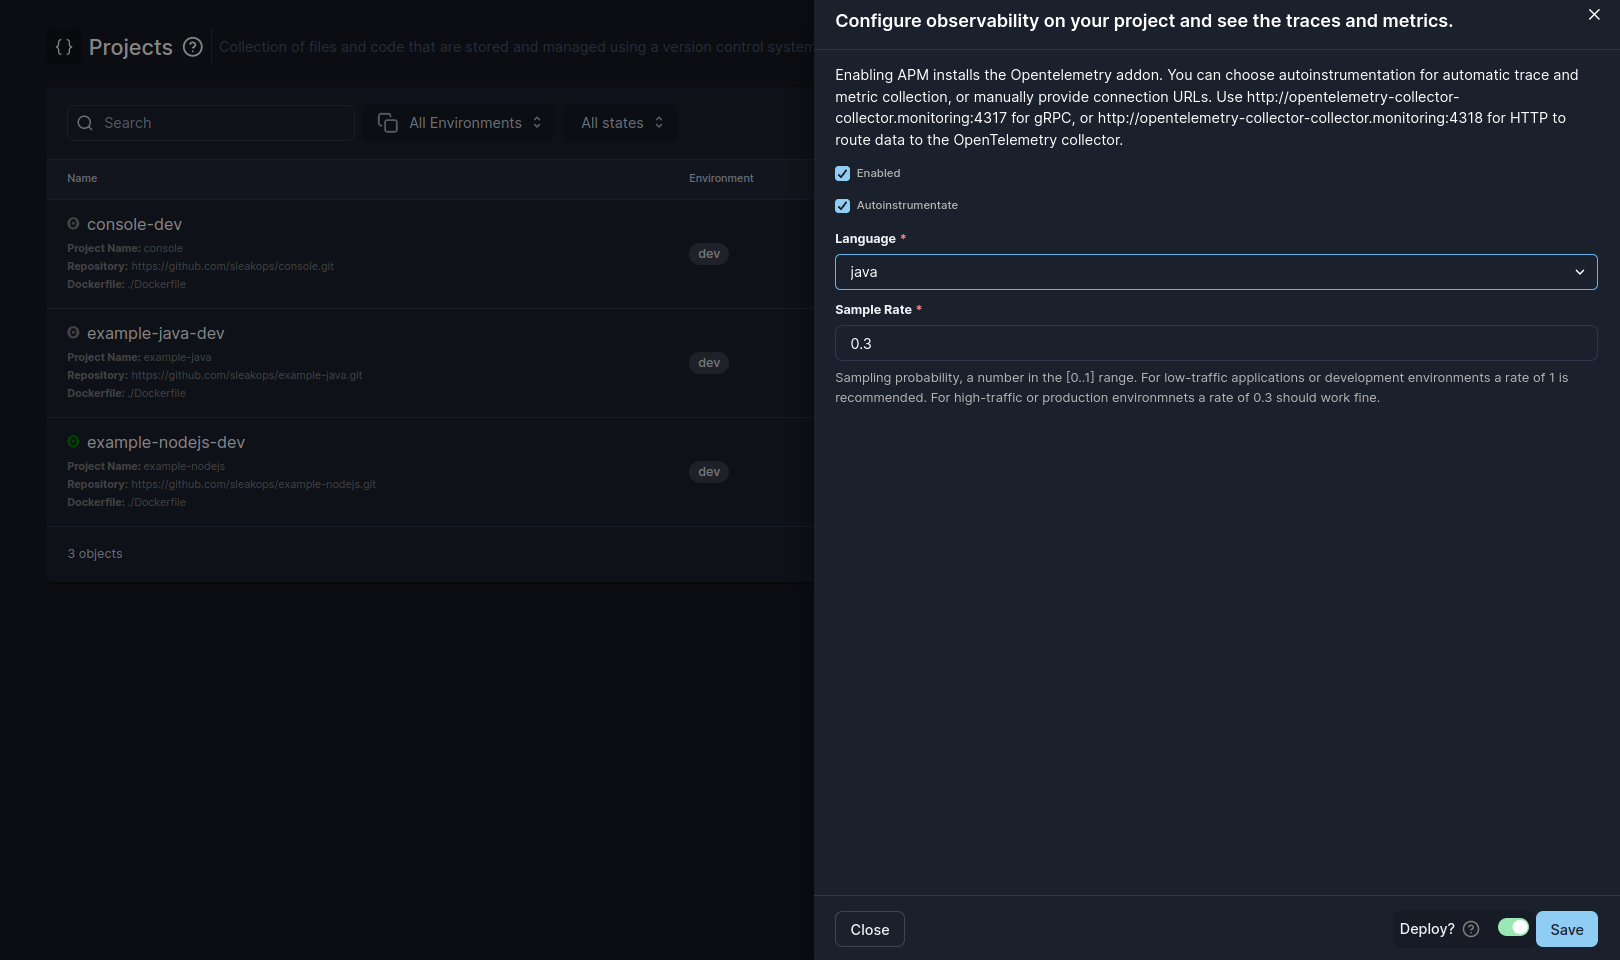
To start using OpenTelemetry, you need to install the addon. Then go to the Project list page, activate the project Instrumentation using the small white icon at the left of the name of the project.

These are the options you can choose from:
| Option | Description |
|---|---|
| Enabled | Enable or disable instrumentation on this proyect. |
| Autoinstrumentation | Opt for autoinstrumentation. Read more on Autoinstrumentation and Manual Instrumentation |
| Language | If autoinstrumentation is enabled, this option marks the language of the project. Currently GO, Java, NodeJS, Python and DotNet are available. |
| Sample Rate | If autoinstrumentation is enabled, this option marks the sampling rate, where 0 is none and 1 is all the traces. |
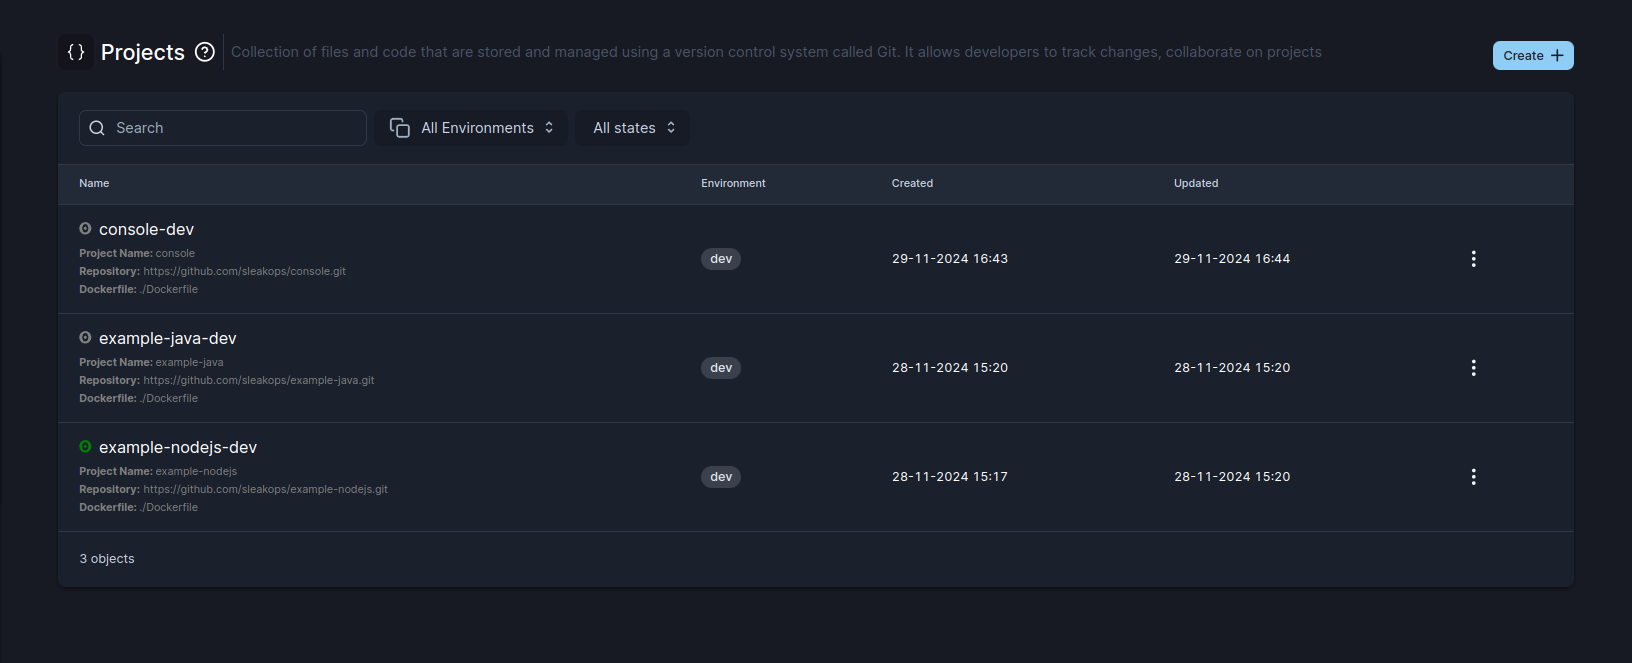
Projects that are instrumented are visible in the Project list page. Marked with a green icon, as in the image:
