Grafana
Introducción
En SleakOps, Grafana es un complemento que te permite visualizar métricas sobre el rendimiento y la salud de tu clúster. Grafana se instala junto con Prometheus para ayudarte a rastrear métricas como el uso de CPU y memoria, además de otros indicadores clave que te permiten monitorear el estado de tu infraestructura en tiempo real.
Además, Grafana es necesario para usar otros complementos como Loki y OTEL.
Preguntas Frecuentes
Acceso a Grafana
Para acceder a Grafana, primero necesitas estar conectado a la VPN, luego simplemente haz clic en el botón de Grafana en la consola de SleakOps.
Cuando creas el complemento de Grafana, SleakOps te proporciona el usuario y la contraseña necesarios.
Serás redirigido a la página de inicio de sesión de Grafana.
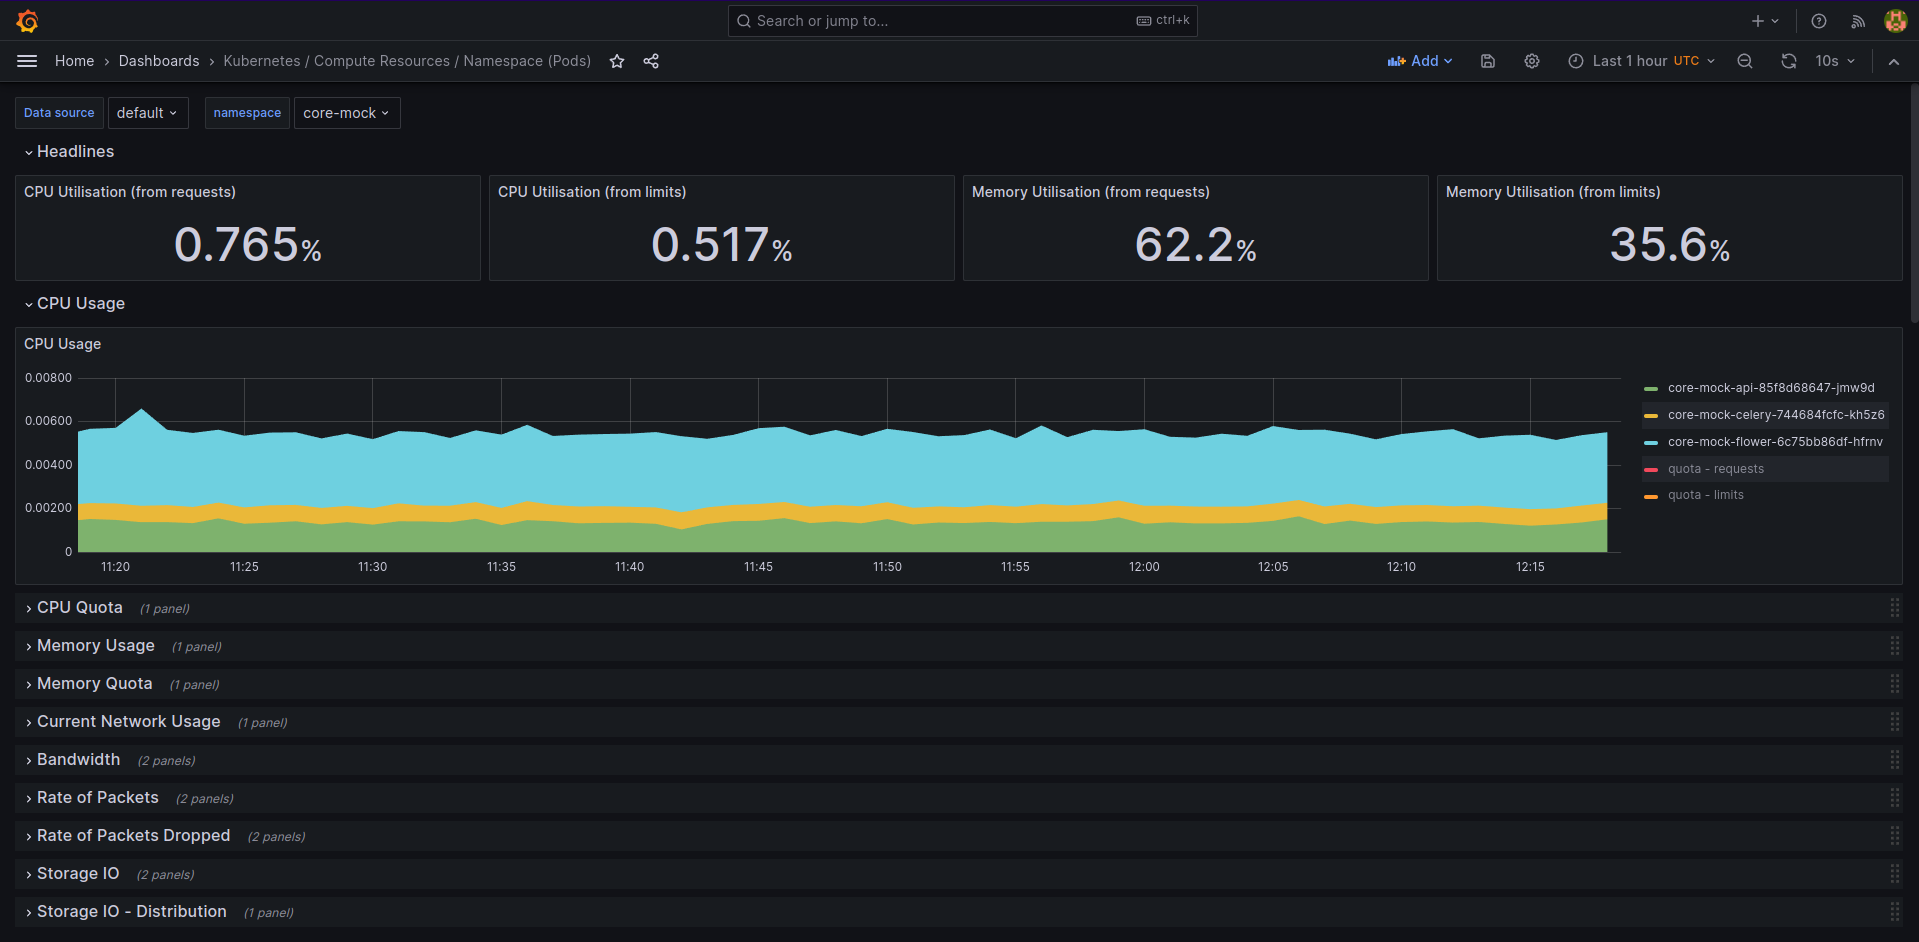
Una vez que inicies sesión, la interfaz de Grafana te presentará un panel como este:

¿Cómo funciona?
Grafana, como herramienta de monitoreo, te permite conectar directamente a las fuentes de datos dentro de tu clúster sin necesidad de una configuración extensa.
Al instalar Grafana, SleakOps configura automáticamente la fuente de datos de Prometheus, brindando acceso rápido a métricas esenciales a través de una interfaz centralizada.
Cuando se instalan Loki u OTEL, estas fuentes de datos también se conectan automáticamente.
Paneles Preconfigurados
Grafana en SleakOps incluye una serie de paneles prácticos. Estos cubren métricas generales del sistema, ofreciendo vistas organizadas para monitorear diversos aspectos del rendimiento de aplicaciones y el uso de recursos. Los paneles están listos para usar y proporcionan visualizaciones de datos consistentes que simplifican el monitoreo y la gestión continua del sistema. SleakOps incluye los siguientes paneles para monitorear asignaciones de recursos:
- Kubernetes / Compute Resources / Cluster
- Kubernetes / Compute Resources / Namespaces (Pods)
- Kubernetes / Compute Resources / Namespaces (Workloads)
- Kubernetes / Compute Resources / Nodes (Pods)
Y estos para monitoreo de redes:
- Kubernetes / Networking / Cluster
- Kubernetes / Networking / Namespaces (Pods)
- Kubernetes / Networking / Namespaces (Workloads)
Además, incluye otros paneles como CoreDNS, que monitorean el sistema interno de DNS y descubrimiento de servicios.
Todos estos paneles son útiles para monitorear la salud de tu clúster y las aplicaciones que se ejecutan en él, especialmente para redimensionar Wrokloads, investigar si se necesitan más réplicas o si los recursos están bien asignados.
Los paneles son personalizables, permitiéndote ajustar el diseño y los datos mostrados según tus necesidades específicas de monitoreo. También puedes crear tus propios paneles.
Visualización de Recursos de Despliegues
Para observar los recursos utilizados por un despliegue, navega al panel de monitoreo de recursos en Grafana.
Una vez que inicies sesión, ve a:
Inicio -> Dashboards -> Kubernetes / Compute Resources / Namespace (Pods)
Este panel está configurado para mostrar datos en tiempo real sobre el uso de CPU, memoria y disco, permitiéndote rastrear y gestionar los recursos asignados a cada despliegue dentro de tu clúster.
